- Category: ArcGIS StoryMap
- Project date: Fall, 2022
- Tools Used: Alteryx, Tableau, ArcGIS Pro
- Project URL: https://storymaps.arcgis.com/LungCancer
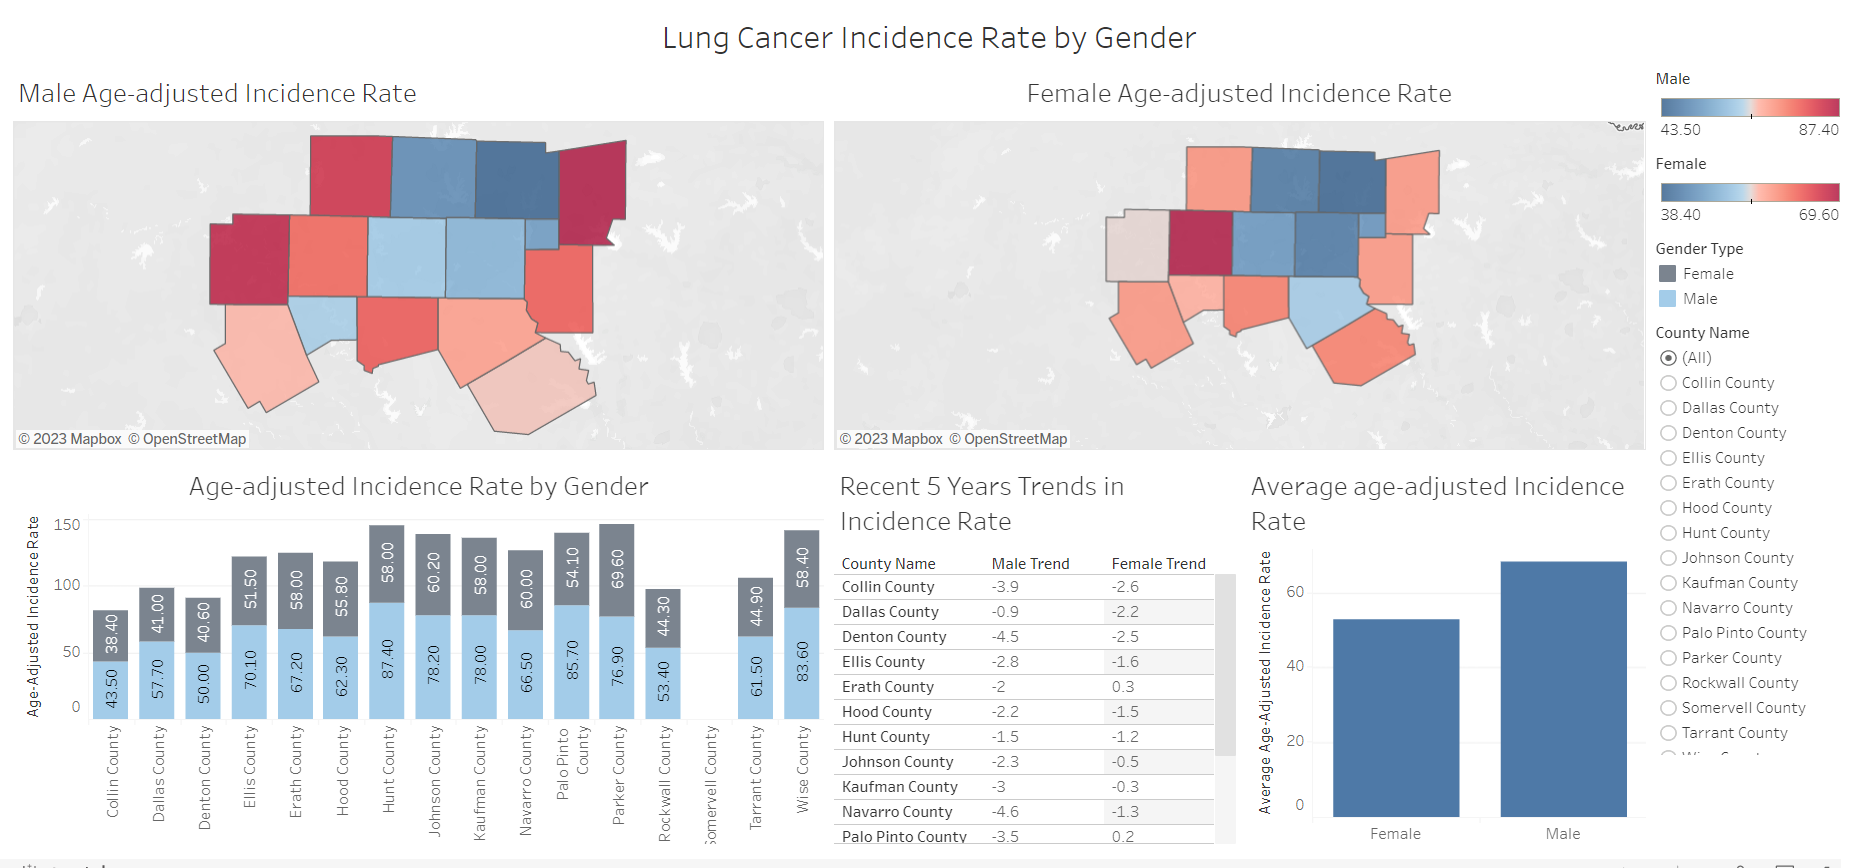
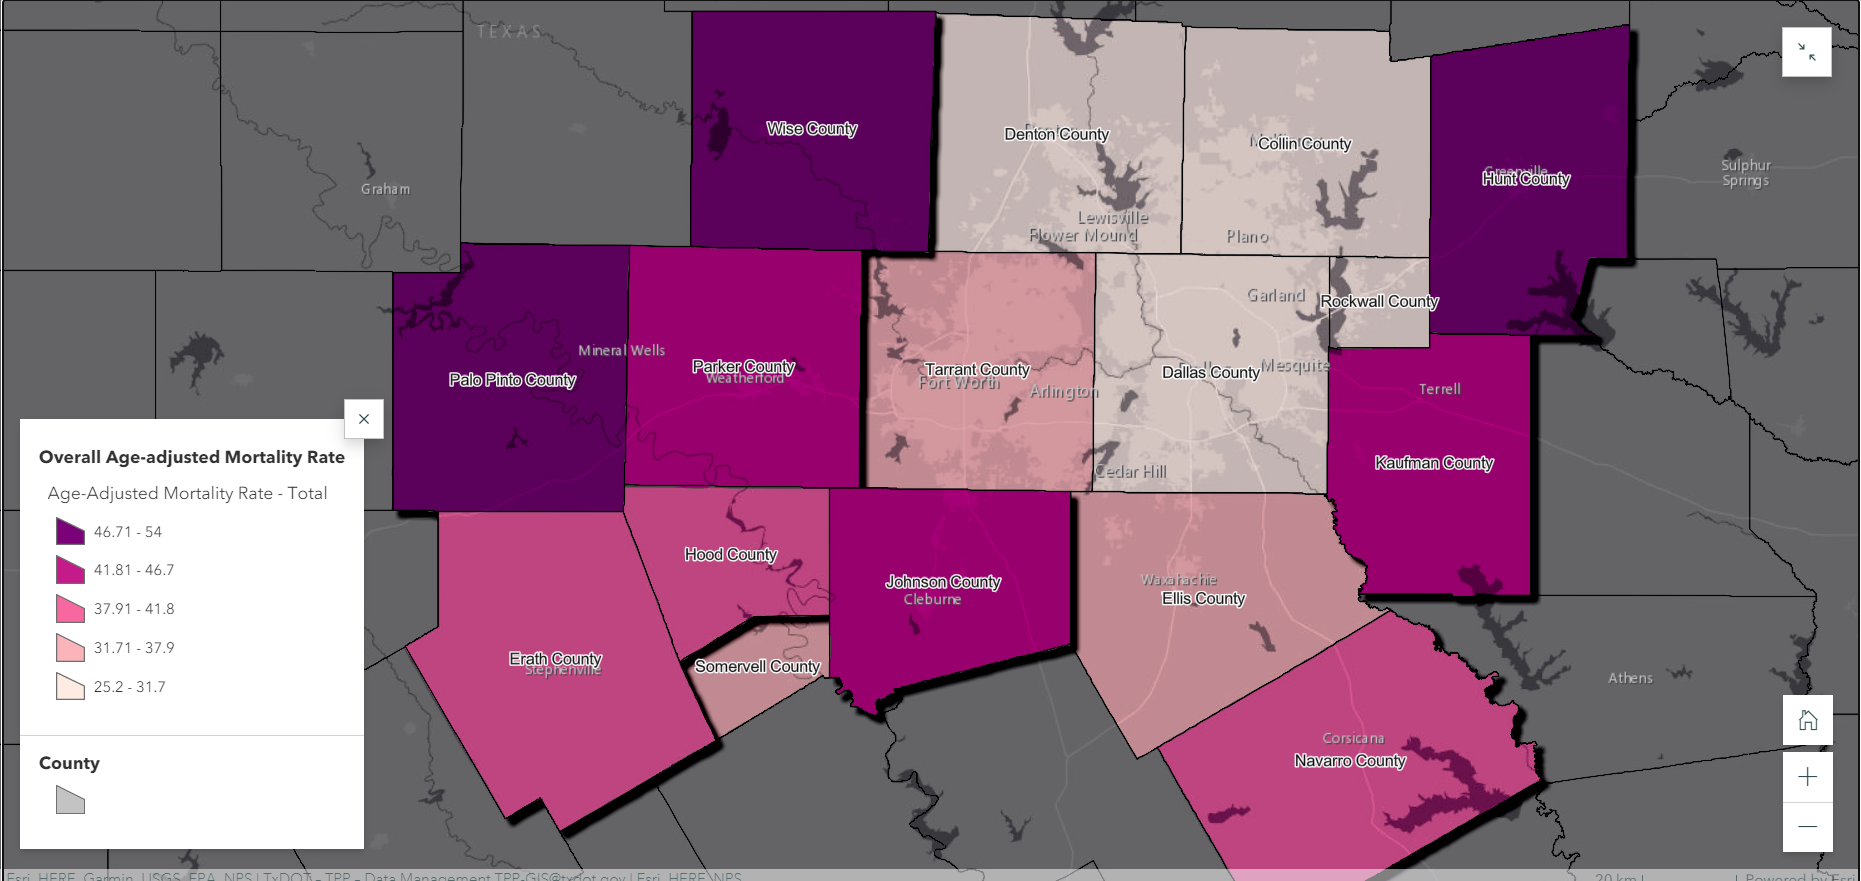
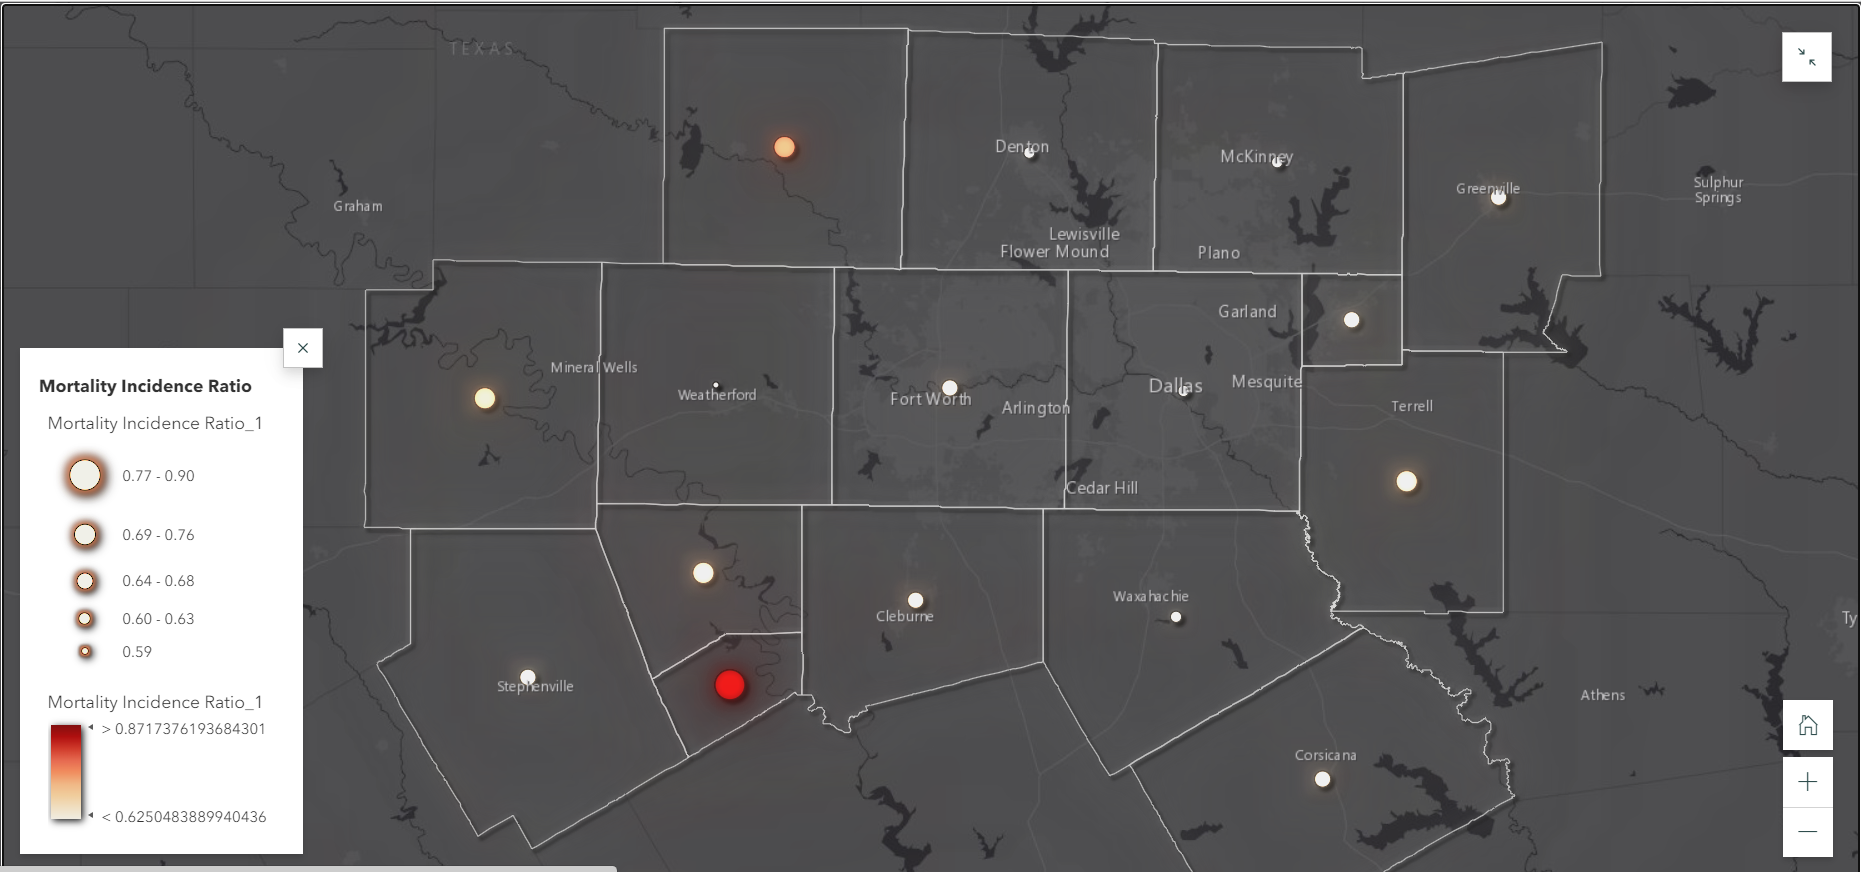
I created an ArcGIS StoryMap as part of a Geospatial Data Visualization and Analytics project that assessed the spatial patterns of lung cancer incidence and mortality in North Central Texas. By utilizing age-adjusted incidence and mortality data, I identified race, gender, and age disparities in lung cancer incidence and mortality. I developed Tableau dashboards that highlighted lung cancer incidence and mortality rates by gender, race, and age, and created interactive maps that illustrated the overall incidence and mortality rate and incidence-mortality ratio. This project was a valuable contribution to the field, providing important insights into the underlying factors driving disparities in lung cancer incidence and mortality across different demographics.